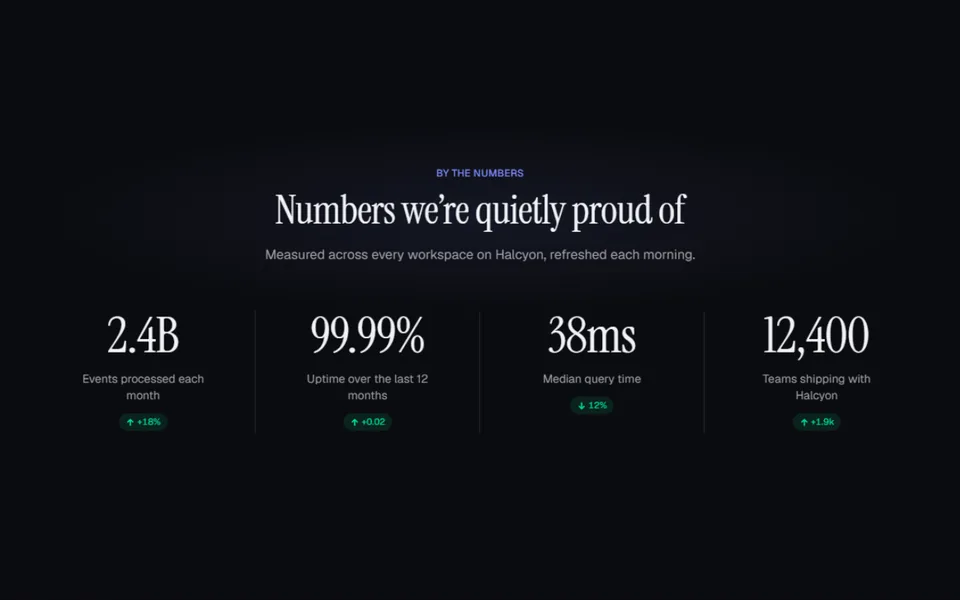
数据指标磁贴
四个大数字从零滚动到目标值,每个下面一条自己描出来的折线。可以是带边框的磁贴,也可以是只有分隔线的一行。数字会定时重播。
- React · SVG
- MIT
- magicuidesign/magicui
- Remix 这个条目
正在载入预览
调参
高亮部分是当前参数,复制和下载都会带上
// SPDX-License-Identifier: MIT// Copyright (c) Magic UI// Source: https://github.com/magicuidesign/magicui/blob/d7207e5/apps/www/registry/magicui/number-ticker.tsx// Modified by Motif; see the item's provenance.import { cn, useFrameLoop } from '@motif/runtime'import { useRef, type CSSProperties } from 'react'/* @motif:defaults */export const defaults = { eyebrow: 'By the numbers', heading: 'Boring infrastructure, measured in public', subline: 'The four numbers we watch every morning, and the ones we would like you to hold us to.', accent: '#2dd4bf', tone: 'dark', font: 'geist', radius: 20, layout: 'tiles', duration: 2, replay: 8,}/* @motif:end */export type StatsMetricTilesProps = Partial<typeof defaults> & { className?: string; style?: CSSProperties }const FONTS = { geist: { family: "'Geist Variable', ui-sans-serif, system-ui, 'PingFang SC', 'Microsoft YaHei', sans-serif", weight: 600, tracking: '-0.045em' }, grotesk: { family: "'Space Grotesk Variable', ui-sans-serif, system-ui, 'PingFang SC', 'Microsoft YaHei', sans-serif", weight: 600, tracking: '-0.05em' }, serif: { family: "'Instrument Serif', 'Times New Roman', 'Songti SC', serif", weight: 400, tracking: '-0.03em' },} as constconst BODY = "'Geist Variable', ui-sans-serif, system-ui, 'PingFang SC', 'Microsoft YaHei', sans-serif"function onColor(hex: string) { const n = Number.parseInt(hex.slice(1, 7), 16) const lum = (0.2126 * ((n >> 16) & 255) + 0.7152 * ((n >> 8) & 255) + 0.0722 * (n & 255)) / 255 return lum > 0.56 ? '#0a0a0d' : '#ffffff'}function palette(tone: string, accent: string): CSSProperties { const dark = tone === 'dark' return { '--s-bg': dark ? '#08090c' : '#f7f6f2', '--s-fg': dark ? '#f5f5f7' : '#0c0d10', '--s-mu': dark ? 'rgba(245,245,247,0.6)' : 'rgba(12,13,16,0.6)', '--s-ln': dark ? 'rgba(255,255,255,0.1)' : 'rgba(12,13,16,0.11)', '--s-cd': dark ? 'rgba(255,255,255,0.04)' : '#ffffff', '--s-ac': accent, '--s-on': onColor(accent), } as CSSProperties}interface Stat { value: number decimals: number prefix?: string suffix?: string label: string desc: string spark: number[]}const STATS: Stat[] = [ { value: 99.98, decimals: 2, suffix: '%', label: 'Uptime, trailing 12 months', desc: 'Measured from three regions, published on the status page.', spark: [8, 9, 8, 9, 9, 10, 9, 10, 10, 10] }, { value: 4.2, decimals: 1, suffix: 'B', label: 'Requests traced a month', desc: 'Up from 1.1B a year ago, on the same collectors.', spark: [2, 3, 3, 4, 5, 5, 7, 8, 9, 11] }, { value: 38, decimals: 0, suffix: ' ms', label: 'p95 ingest latency', desc: 'From SDK call to a trace you can query.', spark: [10, 9, 9, 8, 8, 7, 7, 6, 6, 5] }, { value: 1240, decimals: 0, suffix: '+', label: 'Teams on paid plans', desc: 'Across 61 countries, none of them above 9% of revenue.', spark: [3, 4, 4, 5, 6, 7, 7, 8, 9, 10] },]/** 折线的路径:把数值缩放进 100×32 的画布。 */function sparkPath(points: number[]) { const max = Math.max(...points) const min = Math.min(...points) const span = max - min || 1 return points .map((p, i) => `${i === 0 ? 'M' : 'L'}${((i / (points.length - 1)) * 100).toFixed(1)},${(28 - ((p - min) / span) * 24).toFixed(1)}`) .join(' ')}function format(v: number, decimals: number) { const fixed = v.toFixed(decimals) const [int, frac] = fixed.split('.') return int!.replace(/\B(?=(\d{3})+(?!\d))/g, ',') + (frac ? `.${frac}` : '')}const easeOut = (t: number) => 1 - Math.pow(1 - t, 4)export function StatsMetricTiles({ className, style, ...props }: StatsMetricTilesProps) { const o = { ...defaults, ...props } const font = FONTS[o.font as keyof typeof FONTS] ?? FONTS.geist const host = useRef<HTMLElement>(null) const nums = useRef<(HTMLSpanElement | null)[]>([]) const lines = useRef<(SVGPathElement | null)[]>([]) const tiles = o.layout === 'tiles' const replay = o.replay > 0 ? Math.max(o.replay, o.duration + 2) : 0 // 数字和折线由帧循环直接写进 DOM(不触发重渲染);到点整段重播,截图和循环视频里也能看到。 useFrameLoop( host, ({ time }) => { const phase = replay > 0 ? time % replay : time STATS.forEach((s, i) => { const stagger = i * 0.12 const p = easeOut(Math.min(1, Math.max(0, (phase - stagger) / o.duration))) const el = nums.current[i] if (el) el.textContent = format(s.value * p, s.decimals) const line = lines.current[i] if (line) line.style.strokeDashoffset = String(1 - p) }) }, { reducedMotion: 'static', staticTime: o.duration + 1 }, ) return ( <section ref={host} className={cn('relative w-full overflow-hidden', className)} style={{ ...palette(o.tone, o.accent), background: 'var(--s-bg)', color: 'var(--s-fg)', fontFamily: BODY, ...style }} > <div className="pointer-events-none absolute inset-x-0 top-0 h-[360px]" aria-hidden style={{ background: 'radial-gradient(45% 100% at 50% 0%, color-mix(in oklab, var(--s-ac) 14%, transparent), transparent)' }} /> <div className="relative mx-auto w-full max-w-6xl px-6 py-24 sm:px-10"> <div className="max-w-2xl"> <span className="text-[12px] font-medium tracking-[0.14em] uppercase" style={{ color: 'var(--s-ac)' }}> {o.eyebrow} </span> <h2 className="mt-4 text-balance text-[clamp(2rem,4.4vw,3.2rem)] leading-[1.05]" style={{ fontFamily: font.family, fontWeight: font.weight, letterSpacing: font.tracking }}> {o.heading} </h2> <p className="mt-5 max-w-xl text-pretty text-[16px] leading-relaxed" style={{ color: 'var(--s-mu)' }}> {o.subline} </p> </div> <dl className={cn('mt-14 grid gap-4 sm:grid-cols-2 lg:grid-cols-4', !tiles && 'gap-0 border-t')} style={!tiles ? { borderColor: 'var(--s-ln)' } : undefined}> {STATS.map((s, i) => ( <div key={s.label} className={cn('flex flex-col', tiles ? 'border p-6' : 'py-8 pr-6 lg:border-r lg:pl-6 lg:first:pl-0 lg:last:border-r-0')} style={{ borderColor: 'var(--s-ln)', background: tiles ? 'var(--s-cd)' : undefined, borderRadius: tiles ? `${o.radius}px` : undefined }} > <dd className="order-1 flex items-baseline" style={{ fontFamily: font.family, fontWeight: font.weight, letterSpacing: font.tracking }}> <span className="text-[clamp(2.6rem,4.4vw,3.6rem)] leading-none tabular-nums"> {s.prefix} <span ref={(el) => { nums.current[i] = el }} > {format(s.value, s.decimals)} </span> </span> <span className="ml-0.5 text-[clamp(1.4rem,2vw,1.8rem)]" style={{ color: 'var(--s-ac)' }}> {s.suffix} </span> </dd> <dt className="order-2 mt-4 text-[14px] font-medium">{s.label}</dt> <p className="order-3 mt-1.5 text-[13px] leading-snug" style={{ color: 'var(--s-mu)' }}> {s.desc} </p> <svg viewBox="0 0 100 32" className="order-4 mt-6 h-auto w-full" aria-hidden> <path d={sparkPath(s.spark)} fill="none" stroke="var(--s-ln)" strokeWidth="0.7" strokeLinecap="round" strokeLinejoin="round" /> <path ref={(el) => { lines.current[i] = el }} d={sparkPath(s.spark)} pathLength={1} fill="none" stroke="var(--s-ac)" strokeWidth="1" strokeLinecap="round" strokeLinejoin="round" style={{ strokeDasharray: 1, strokeDashoffset: 0 }} /> </svg> </div> ))} </dl> </div> </section> )}